Our AI Technology
We use advanced AI and machine learning to identify anomalies, fraud, and risks in business data.
What We Process
The Intelligence Company processes a large amount of data sources around companies around the clock. But with our license as a nationwide credit reporting company, we also have all Swedes from 15 years of age in our register.
Note that for individuals we only process the information that is necessary to offer credit reports with inquiry copies on the market. The full list of these data sources can be found under About Us.
We primarily use anomaly detection.
What is Anomaly Detection?
Anomaly detection means distinguishing data that is unusual or different from a large amount of data. It is about identifying things that stand out from a large amount and can be perceived as different.
In anomaly detection, machine learning is used, a part of artificial intelligence, AI. A computer is taught normal patterns and flags events that do not correspond to normal behaviors.
Cluster Analysis
This means that the data set is grouped into similar subsets called clusters. The center, i.e., the center of gravity of the clusters, is called centroid, and the distance from the centroid to the members is measured. If data points are too far outside the centroid, it means an anomaly. An image from Wikipedia shows an example:
Within clustering, there are several methods and algorithms including K-Means, Mean-shift, and agglomerative hierarchical clustering.

Decision Trees and Regression Analysis
A decision tree is a model where questions are asked and depending on the answers, you move to the next branch. For example, decision trees can be used to predict bankruptcies in companies. The tree can involve YES/NO questions, i.e., binary trees, or trees where the answer can be a range.
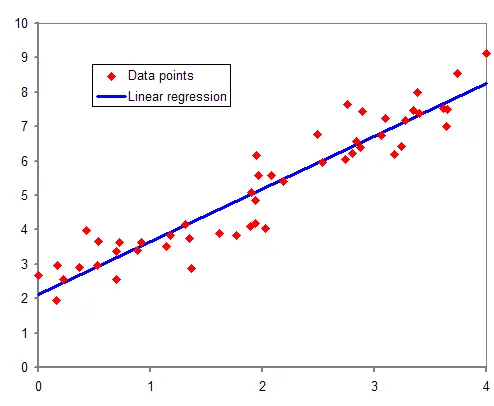
Decision trees are often used together with regression analysis, where there are several variants, and the simplest is linear regression, which involves finding a linear relationship, i.e., a straight line, that fits through a set of points. An image from Wikipedia shows an example where the blue line best represents the data set.
A good example of how regression analysis can be used is if you collect age, gender, weight and height of people and draw a line that best fits each data set for gender and age. Then you can use the line to predict what the weight is given the person's height, age and gender.
Neural Networks
Neural networks are one of the more advanced machine learning algorithms and are most often used to solve complex problems. Neural networks consist of interconnected nodes in multiple layers where each node receives data, uses an algorithm and passes data to the next node.
The neural network is trained by adjusting the weights on the links between the nodes. Two common use cases are, for example, discovering patterns in unstructured information or identifying patterns.
An image from Wikipedia shows in simplified form how neurons are interconnected:

Safer and easier business.
Our AI platform constantly monitors hundreds of data sources to identify anomalies and patterns in registries, annual reports and other sources. Know who you're doing business with and avoid unpleasant surprises.